MIS Report: What It Is and Why It Matters in Business MIS basically known as Management Information Systems , the rounded quantities collected, organized, analyzed and presented to produce meaningful outcomes are what drives decision making in the business environment. Accordingly, MIS Reports provide evaluating the overall performance of the business; managing and controlling operational processes and identifying potential problems prior to occurring and formulating long-term strategies based on measurable outcomes.
Regardless of the size of the business, an MIS report provides measurable data and factual details instead of relying on assumption or guesswork. In addition an MIS report turns raw data into actionable management information that can help you to make decisions regarding their business.
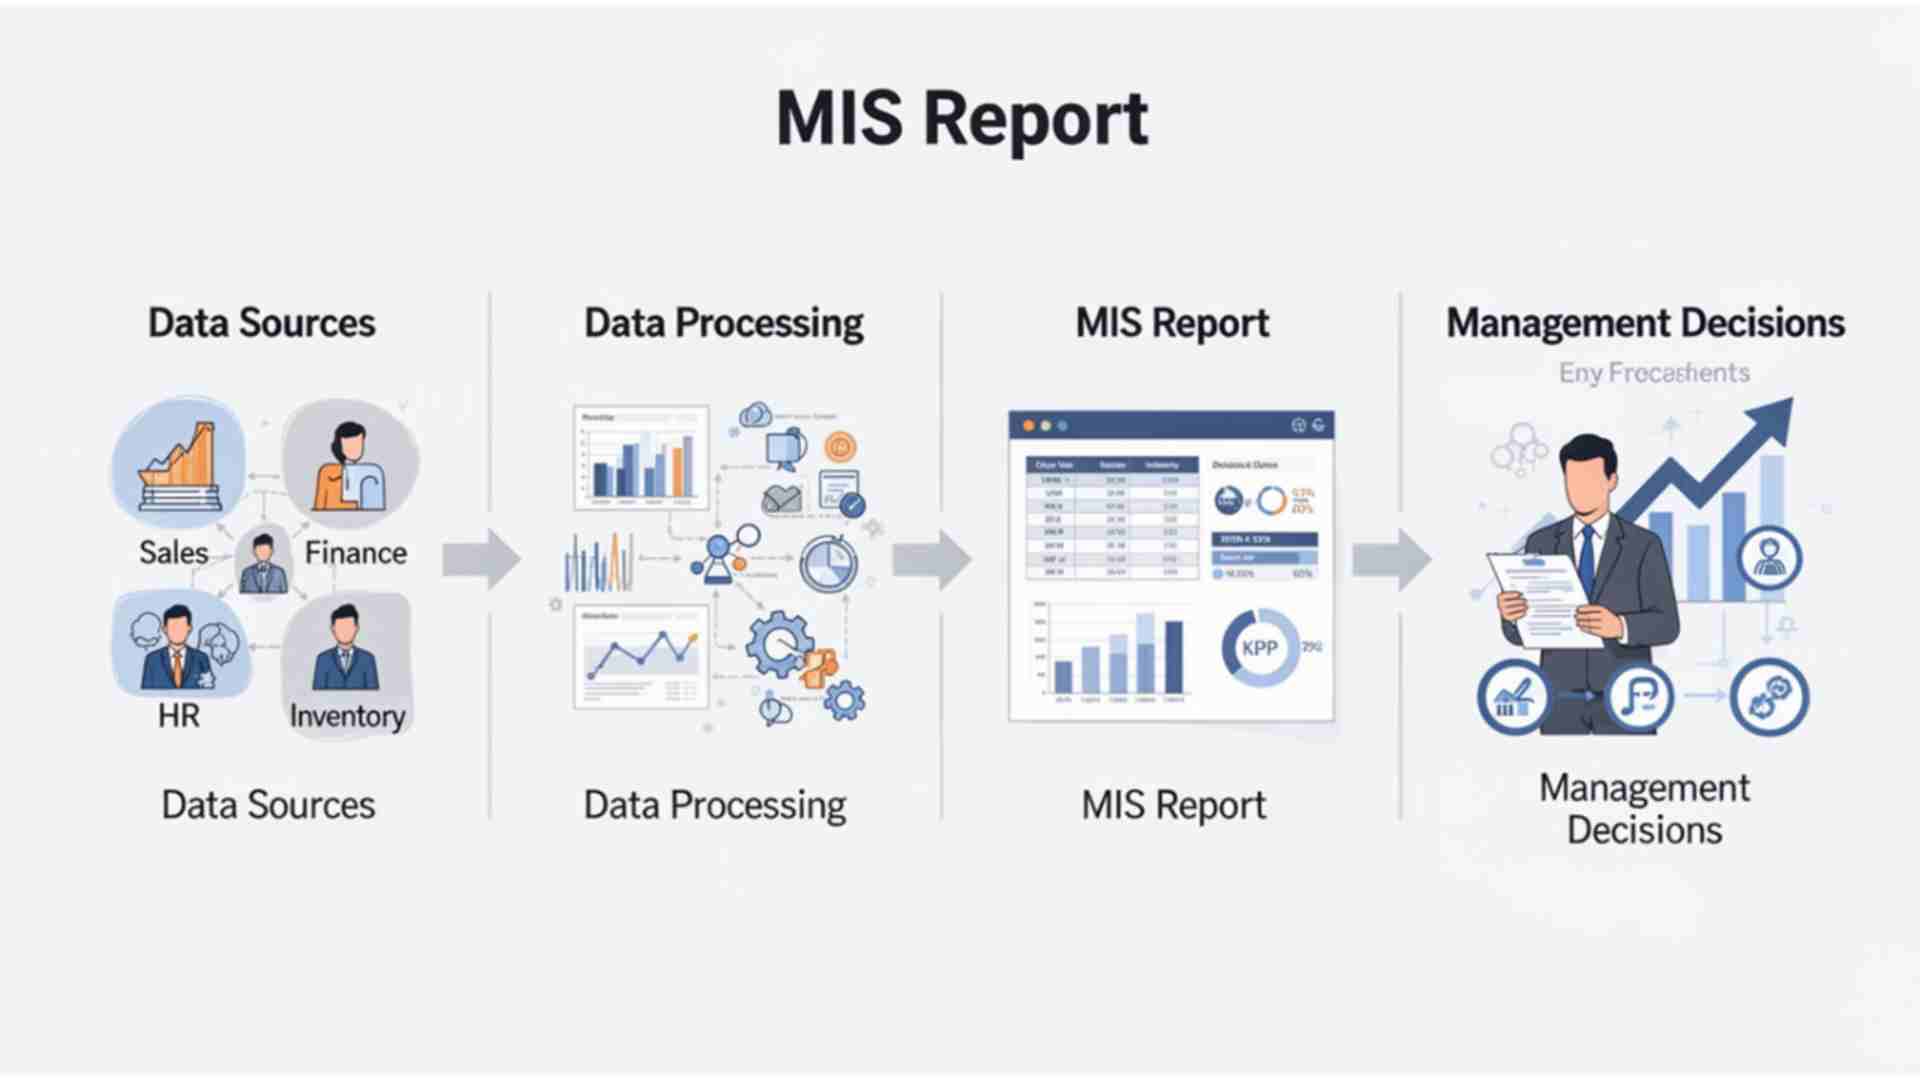
What Is an MIS Report MIS Reports are structured Business reports developed from data captured by the bus that ultimately provide manage with the necessary management information across all levels of management throughout the organ MIS reports summarize and provide various data related to the function areas of the business; Including but not limited to sales , finance, operations, human resource, inventory and production.Key Characteristics of MIS reports They are based on current business data as opposed to opinion They are presented in a consistent structure They are updated on a regular basis They are generated for specific business purposes They are presented in a way that is easy to understand They include visual representation Why MIS Reports Matter in Business Current-day business management relies heavily on Management Information Systems (MIS) reports. And while they may appear to be nothing more than pretty pieces of paper, they have a direct impact on successful business operations as practical tools. Here are five important reasons why MIS reports are necessary:
Tracking Performance and Growth] MIS reports can provide the actual numerical picture of sales, revenue, expenses and profits so that you can determine how your business is growing stable or declining month-by-month.
Identifying Problems Soon When there are regional drops in sales, for example or when inventory is sitting in a warehouse, the use of MIS reports brings these issues into the spotlight immediately, allowing you to rectify them before they become bigger.
Improving Co-ordination Among Departments When all departments use the same reports, they are all operating on one record. The sales department knows how much the production department can produce, the finance department knows how much budget there is avai;able.
Increasing Control Over Resources Management Reports System will enable you to track where you spent money, the flow of inventory and employee productivity. All of these areas will assist in avoiding waste or misusing resources
Types of MIS Reports Different MIS reports are prepared for different business functions and needs. Here are the most common types used across industries
Types Purpose Example Usage Sales MIS Tracks sales performance for all products, all areas and all timeframes Monthly sales breakdown by area, revenue breakdown by product, sales performance by salesperson Inventory MIS To track inventory levels and movement within your organization Determining what items are overstocked, fast-moving vs slow-moving items, re-order alerts Financial MIS To monitor the overall financial conditions and cash availability for a business Profit and loss statement, tracking of cash flows. Analyzing expenses, trends of revenue
Key Components of an MIS Report A well-structured MIS report should be complete, clear and actionable. Here are the essential components that make an MIS report effective.
Components description Report Title A description title that summarizes the type of report and its timeframe (e.g. “Monthly sales MIS - January 2024”) Data source A source of data, such as your own company's internal systems, such as billing/ERP/CRM/ accounting software KPIs & Metrics A performance metric or value that you use to measure performance; for example, total sales, total units sold, average profit per unit Data analysis A process for analyzing data for comparability - what the number means based on analysis Visual presentation Visual representation of data in chart form (graph, pie, chart, etc.) so that the reader can easily understand the data at a glance Summary A summary of the collected data, with any important finding or observation from it
How to create an MIS Report Step 1: Define the purpose Determine why you are measuring performance indicators (KPIs) and how you will use those measurements for your business, don’t bother producing reports if you don’t need them.
Step 2: Identify Key Benchmarks It's important when developing KPIs that you select only those KPIs that are of great importance to your organization; if all KPIs are included, determining how each affects the overall performance will be difficult.
Step 3: Use reliable data The data reported be accurate and dependable so that the final report will be dependable; data from sources that are less reliable or from previous time periods can dramatically reduce that value of the generated report.
Step 4: Provide Readable Visual Data Visual data can be used to communicate the data displayed in reports with graphs, charts and tables. The types of visual data utilized should be readable.
Step 5: Provide Context concerning Your Numbers Statistical context should be presented in conjunction with your reported KPIs and any explanations of why there were changes during the reporting period should be included.
STep 6: Back-Test Data Consistently Using the same metrics and time frames will allow you to compare different datasets across periods of time.
Conclusion MIS Reports have proven to be an essential tool for organizations of all sizes to operate at optimum levels and remain competitive in today’s rapidly changing marketplace. A timely, accurate and relevant source of information provides managers with a viable means of supporting better decision-making, enhancing operational control and ultimately contributing long-term growth and profitability.
With an ever-increasing reliance on data in our business environment, organizations that utilize MIS to their full potential will be more successful at managing risk, identifying opportunities. From in-depth tracking of daily sales activity to updated monthly expense reporting or quarterly growth reporting, MIS provides organizations with the capability to turn raw data into useful, actionable insight that drives business success.
FAQs WHat does MIS stand for? MIS stands for Management Information System. It is helpful in the systems and reports that provide information to help managers run the business effectively.
How often should you produce an MIS? MIS Report Frequency is determined by your business's reporting requirements. Examples include daily sales reports to weekly, then on the same schedule, for financial report filing.
Are MIS reports beneficial to small businesses? Yes, they are very beneficial for small businesses , they can use the same type of reports that large businesses do. For example, many small businesses could gain valuable insight into how much they sell, spend and keep stock.
What is an MIS Report vs Regular Report? An MIS report is an organized regular report based on data that aids in decision making by utilizing regular management information. A regular report on an hoc basis can be created for anything but will have no formalized structured or consistent creation process.
.png)
-compressed.jpg)
.jpg)