What is Ratio Analysis and Why It Matters in Accounting Revenue climbs. Cash feels tight. The statements look fine, yet decisions miss the mark. Ratios expose the gap between numbers and meaning. They flag risk early, show momentum, and keep surprises small. You’re in the right place. This piece breaks ratio analysis into clear signals you can act on. We cover what ratios reveal, why they shape accounting decisions, and how to read them without guesswork.
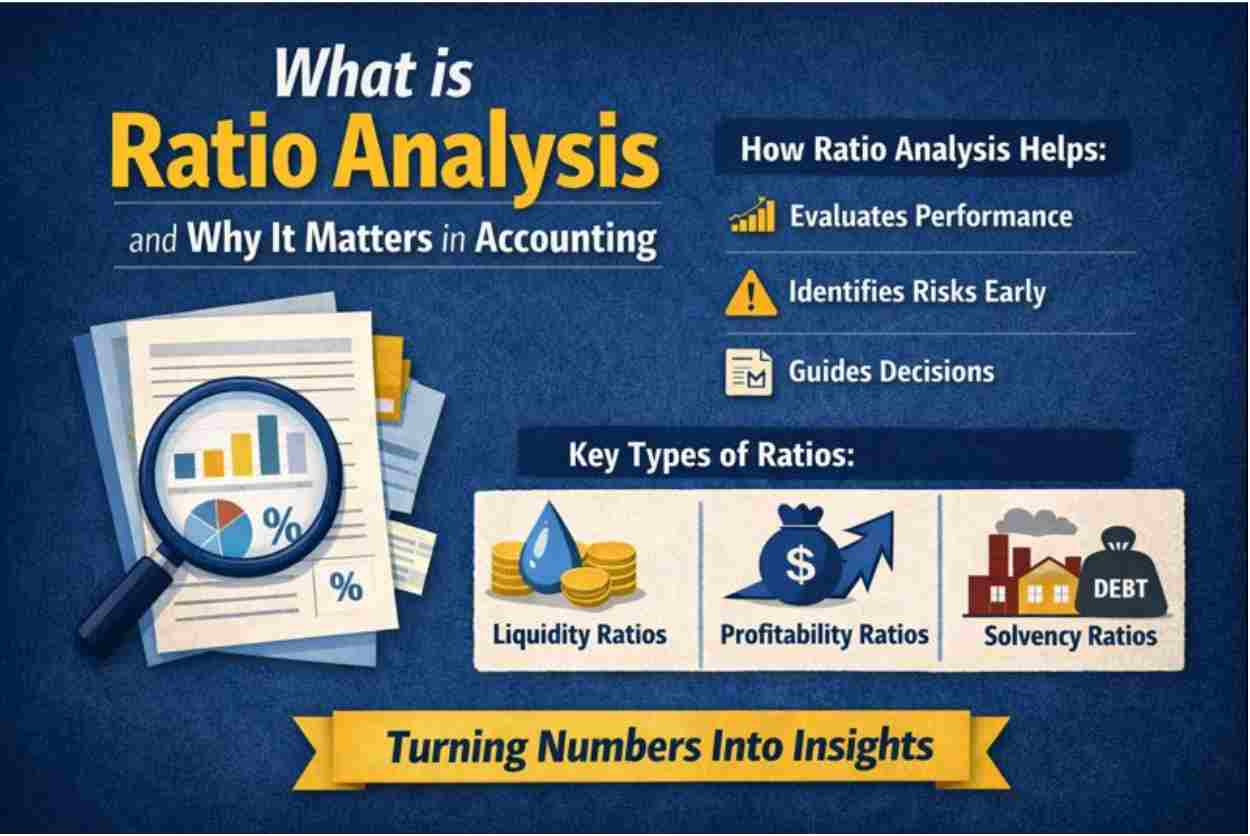
Core ratio types and what each signals
How to read trends and benchmarks
Where ratios mislead and how to avoid traps
What is ratio analysis? Ratio analysis is a quantitative method that compares related figures from financial statements to explain performance, risk, and stability. We calculate ratios using data from the balance sheet, income statement, and, at times, the cash flow statement. The goal remains simple: turn financial data into actionable signals.
Raw numbers can be misleading when they stand alone. Revenue looks strong. Assets look healthy. Yet cash strains and margins slip. Ratios fix that blind spot. They work like financial vital signs, showing liquidity, profitability, efficiency, and solvency in a form that reveals what’s working and what needs attention.
Why ratio analysis matters in accounting Financial statements show what happened. Ratios explain why it happened and what comes next. They convert rows of numbers into insights you can use, spot trouble early, and defend decisions with clarity.
Ratios surface patterns that raw data hides. You see where the business wins, where it leaks value, and where risk builds quietly.
Strengths worth protecting
Weaknesses that drain results
Risks tied to debt, cash, or margins
Trends that signal momentum or slowdown
In accounting, ratios sit at the centre of real work. They sharpen reporting, guide analysis, support compliance checks, and ground business planning in evidence instead of instinct.
Who uses ratio analysis and how Ratio analysis speaks a different language to different decision-makers. The math stays the same. The question changed.
Investors They read ratios to judge profitability and risk before money moves. Comparisons across companies expose pricing discipline, margin quality, and balance-sheet pressure that earnings headlines miss.
Compare returns across peers
Spot overvaluation or stress early
Creditors and lenders They focus on liquidity and solvency. Ratios show whether cash can cover near-term obligations anddebt loads stay manageable.
Decide on loan approval
Price interest based on risk signals
Management They use ratios as internal diagnostics. Trends reveal where operations drift, costs swell, or assets sit idle.
Track performance over time.
Support forecasting and budgeting with evidence
This shared framework keeps decisions aligned, even when incentives differ.
How ratio analysis is used in practice Ratios matter most when you compare them. A single snapshot says little. Movement tells the story.
Trend analysis tracks the same ratio across periods. You watch margins tighten, liquidity thin, or leverage creep up. Small shifts flag issues early, long before statements raise alarms. Looking at ratios over time helps you see what’s quietly slipping, not just what changed last quarter.
Benchmarking adds perspective by showing how those numbers stack up against similar businesses. Context sets the bar. A debt level that fits utilities strains a SaaS firm. Inventory turnover that works in retail fails in manufacturing. A “good” ratio only makes sense inside its operating environment. Read ratios next to business models, cost structure, and market norms.
Why ratio analysis alone isn’t enough Ratios look backward. They rely on historical data, which means timing matters. A clean ratio today may reflect conditions that no longer exist.
Numbers can bend under pressure. Accounting policies shift results. One-time events inflate or crush performance. Creative reporting smooths edges that deserve scrutiny. Ratios don’t lie, yet they don’t tell the full story on their own.
Read ratios as a system, not a single data point.
Pair liquidity with solvency
Read profitability next to efficiency
Check trends, not isolated results
Patterns reveal reality. Isolated ratios create false comfort.
Key takeaways for accounting professionals Ratio analysis compares related financial data to explain performance, risk, and stability. It turns statements into signals that support real decisions.
It matters since numbers alone mislead. Ratios surface strengths, expose weak spots, and flag risk before it shows up in results.
Use ratios responsibly. Read trends, compare peers, and group signals instead of chasing single metrics.
Calculation gets you started. Interpretation decides whether insights drive progress or confusion.
Conclusion You now know how ratios turn financial statements into clear signals, where they guide decisions, and where judgment matters most. Those points keep ratio analysis tied to real work, not theory.
Ratios start to mean something when you look at them together, follow them over time, and compare them with similar businesses, not when you fixate on one number from a single period.
Good accounting decisions rely on judgment. The math supports the call, but it doesn’t make it for you. Context, trends, and industry norms decide whether a ratio points to strength, early strain, or poor resource use.
Used consistently, ratios sharpen reporting, planning, and reviews. They help teams spot issues sooner and explain results clearly, instead of scrambling to justify outcomes after the fact.
That’s where Swipe
FAQs What is ratio analysis in accounting? Ratio analysis looks at how financial statement numbers connect with each other. It helps you judge performance, spot growing risk, and see whether the business stays financially steady over time.
What is ratio analysis important for? Ratios surface what raw figures miss. They show what’s working, where things are starting to slip, and where risk needs a closer look. That’s why they’re used when people make calls about reports, plans, loans, or investments.
Can ratio analysis be misleading? Yes. Ratios reflect past data and can shift due to accounting choices or one-time events. Reading ratios together and across periods reduces false signals.
How do accountants use ratio analysis? Accountants track trends, compare benchmarks, support forecasts, review controls, and explain performance. The value comes from interpretation, not calculation alone.
.png)
-compressed.jpg)
.jpg)